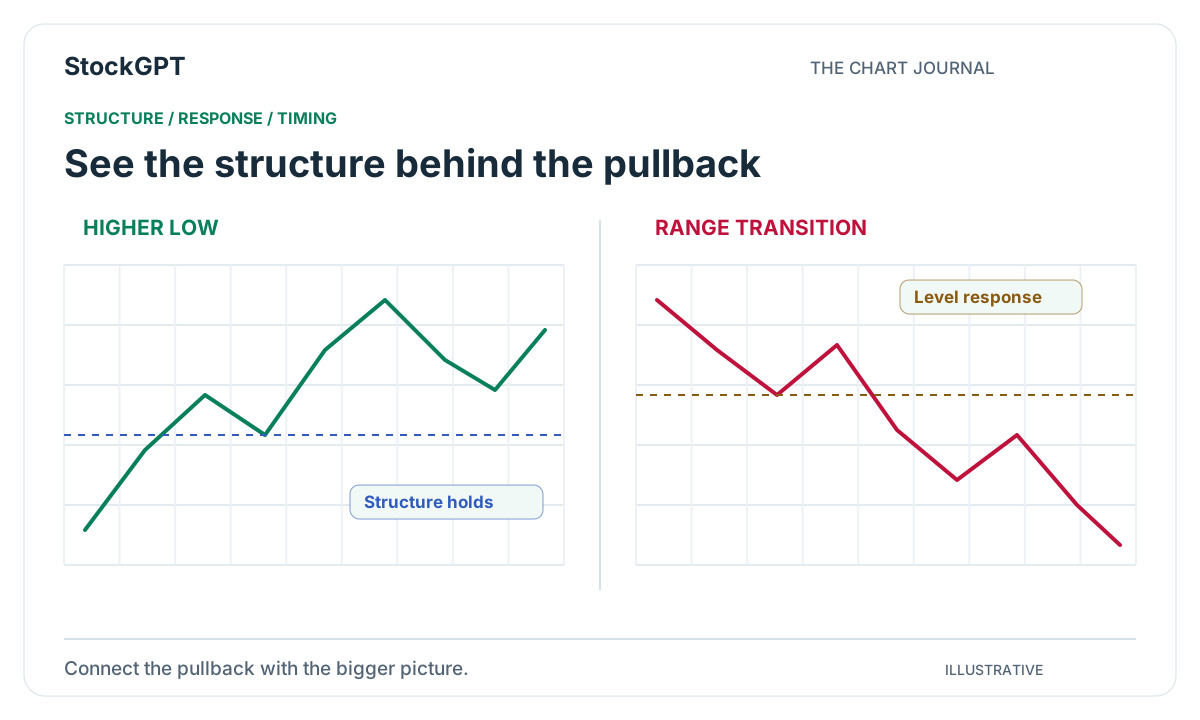
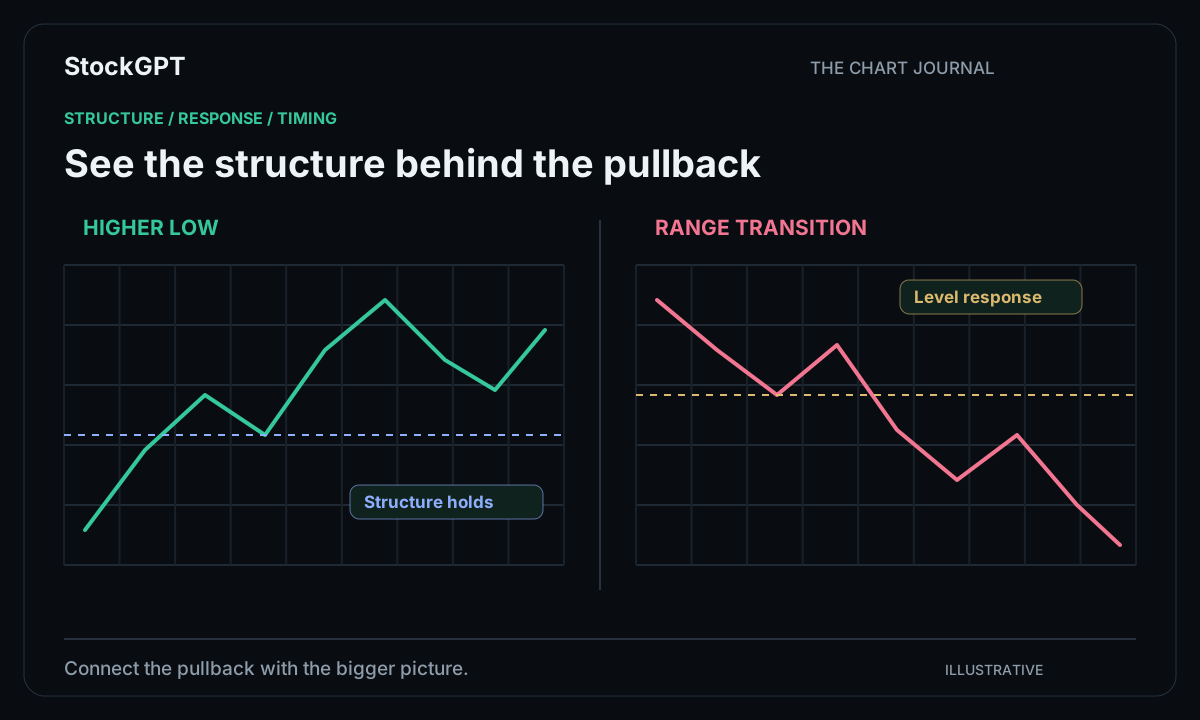
A strong market move is rarely a straight line. The pauses and returns toward familiar levels are part of what makes chart analysis interesting. Pullback studies focus on those moments: where the market takes a breath, how the structure develops, and which readings draw your attention. StockGPT gives you a connected set of tools for exploring the sequence.
Begin with the larger structure
Look at the sequence of highs and lows before focusing on the latest candle. This gives the pullback a setting. You can see how it relates to the earlier advance, where the market previously paused, and which areas deserve attention now.
Imagine a stock moving from $90 to $100, returning toward $96, and then advancing to $105. A later pause around $100 has a clear place in that sequence. Writing down the structure helps you explain the setup and compare it with other examples.
Mark the area you want to study
Choose a relevant price area before zooming into the response. It might be a previous breakout zone, a recent swing level, or an area highlighted by your volume analysis. Give the level a reason to be on the chart.
StockGPT’s Volume Profile can help you explore estimated activity across price levels. Compare its references with the existing structure so the pullback is connected to both location and participation. That combination gives your review more detail than the size of the price move alone.
Watch the response develop
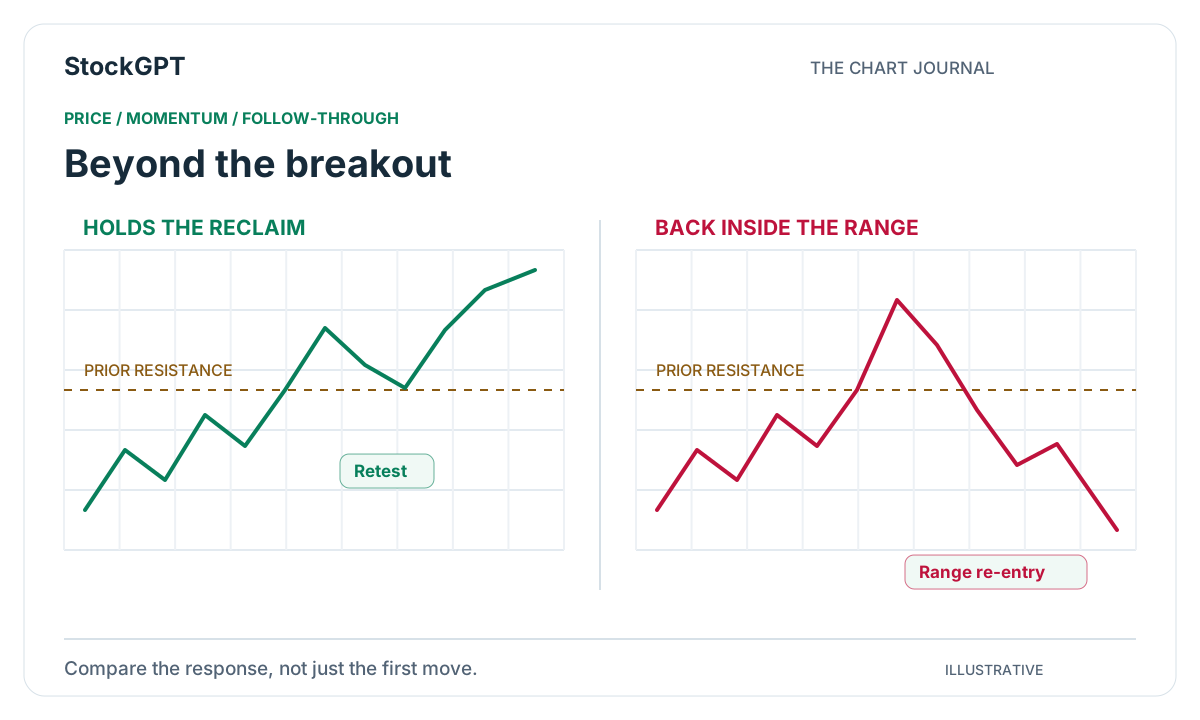
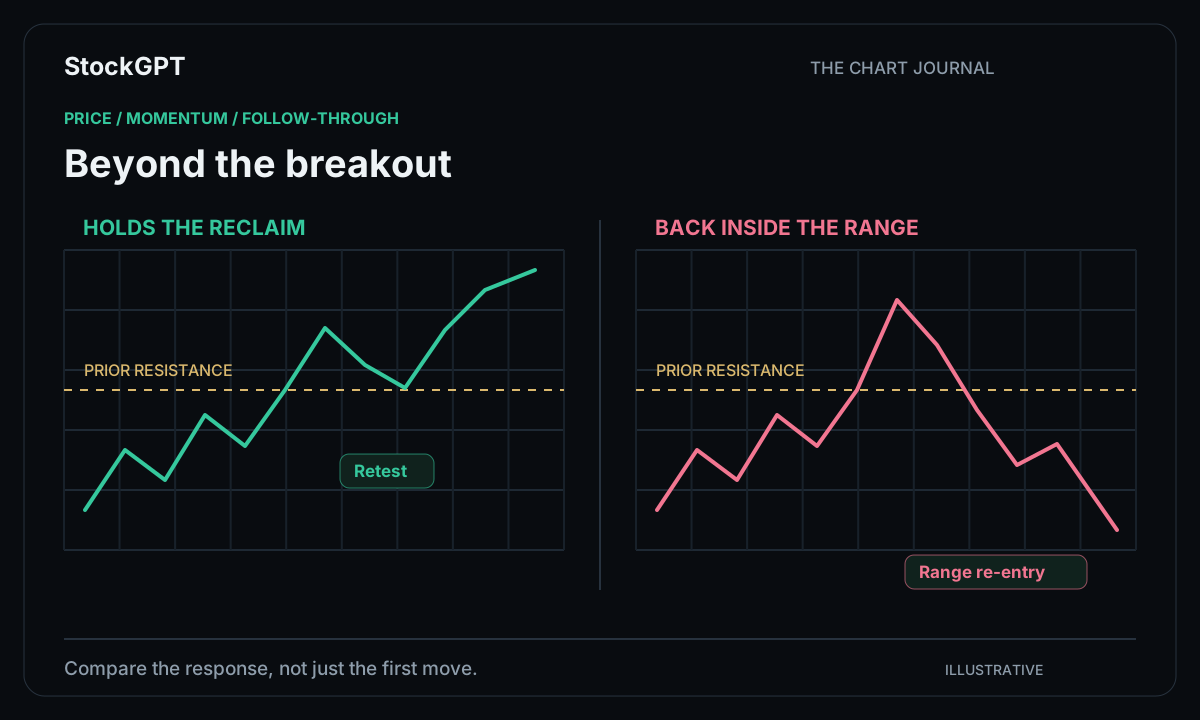
Once price approaches the area, follow the sequence of candles. Look at the close, the next response, and how the structure takes shape. A pause, a reclaim, or a renewed directional move can each provide a useful example to document.
Keep your chosen timeframe consistent while studying the sequence. This makes it easier to describe what changed from one candle to the next and to revisit the same chart later. The goal is a clear observation that you can recognize again.
Connect the pullback with indicator alignment
StockGPT combines multiple indicator readings into its consolidated BUY/SELL signal view. Use that view alongside the chart structure, then open the individual trend and momentum tools for a closer look.
A trend view can describe the broader direction, while a momentum tool explores how the pace changes during the pullback. Volume adds another perspective on activity around the level. Together, these views help you build a fuller explanation of the setup you are studying.
Build a collection of recognizable setups
Save the chart, note the settings, and write a short explanation of why the area stood out. Over time, you can group examples by the type of pullback, the surrounding structure, or the indicator combination you used.
Both StockGPT plans include the core charting tools and AI-powered signals. Gold adds Paper Trading and alerts, giving you additional ways to practice the sequence and stay connected to supported market updates. Start with a focused study and let the routine grow as you become familiar with the workspace.
- Identify the broader trend.
- Choose a meaningful price area.
- Follow the candle response.
- Compare indicator alignment.
- Save the setup and review its development.
Reader questions
Which indicators can help with pullback analysis?
Trend views help establish direction, momentum tools show changes in pace, and volume tools add activity context. StockGPT lets you explore those perspectives alongside the consolidated signal.
Can I study pullbacks in stocks and cryptocurrency?
Yes. StockGPT provides chart analysis for both asset classes. Choose the instrument and a consistent timeframe, then apply the same review sequence to your selected market.
Bring your analysis together.
Explore StockGPT’s AI-powered indicators, combined BUY/SELL signals, and Market Sentiment in one workspace.